The Power of Technical Analysis
The market is controlled by the smartest people with the most money. Their actions inform the direction of capital, providing an edge to participants who follow the trend.
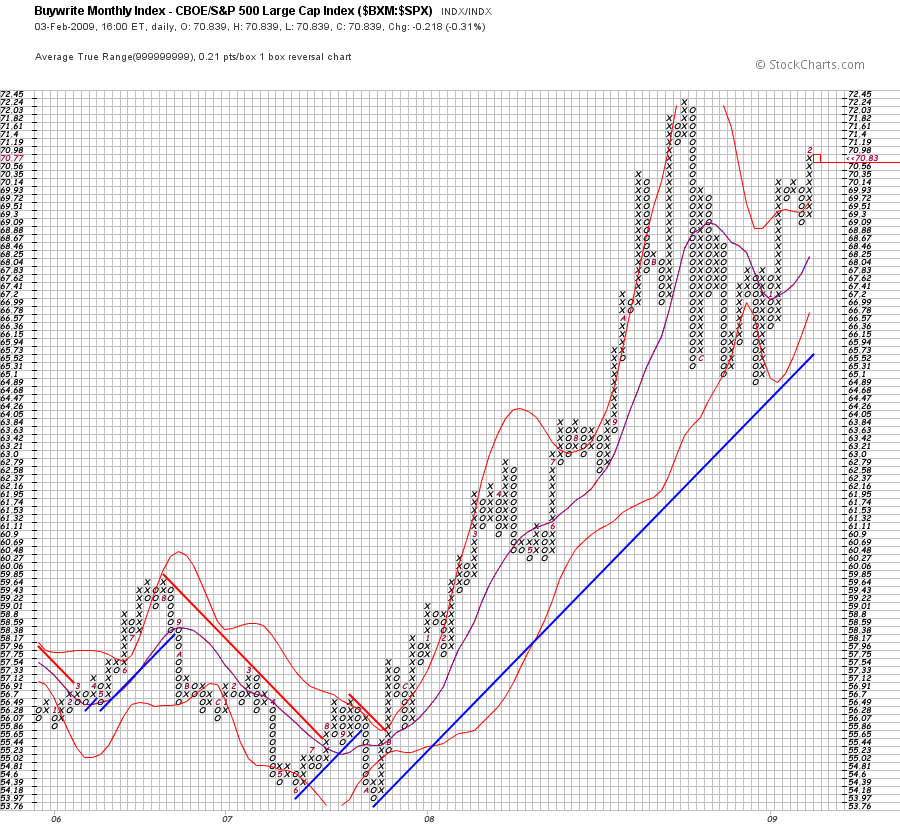
This iteration of the SPX Buywrite : SPX ratio goes back to 2006, and is shown in non-linear time. The distance between years on the X axis is an expression of the yearly volatility, with greater space between numbers signifying more variance. The Y axis is scaled to the Average True Range (ATR) of this benchmark, creating a meaningful barometer for observing price action – the vertical axis is unique to the function.
Charts like this are valuable to investors and day traders alike, for it symbolizes a particular and revealing aspect of market conditions. Since the newest row of information is comprised of X’s on the far right, it signifies that hedged positions are out performing their long counterparts. The duration of this condition is random, but since that is what the market is doing NOW, it is prudent to have your portfolio reflect this reality.
The actions this fact dictate are dependent upon the risk tolerance and objectives of the individual investor. Those who look to make money by buying stocks should tread carefully and beware buying cheap stocks getting cheaper. That said, if today’s strength rolls into tomorrow, a new trend of O’s may appear, so I’ll stick to day trading until things stabilize.
