3 NASDAQ Charts
Price is the only thing that pays, but it’s not the only thing to watch.
-
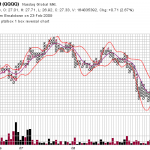
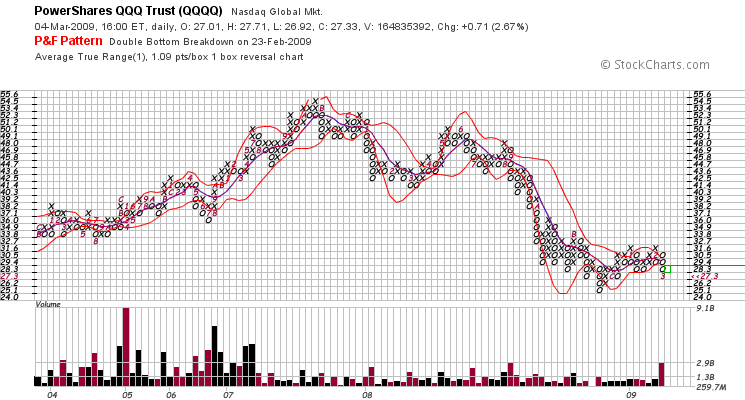
- 1 : NASDAQ 100
-
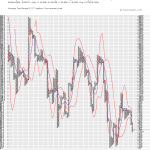
- 2 : % of Rising NASDAQ Stocks : NASDAQ Volatility Index

-
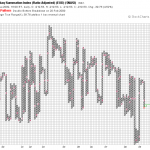
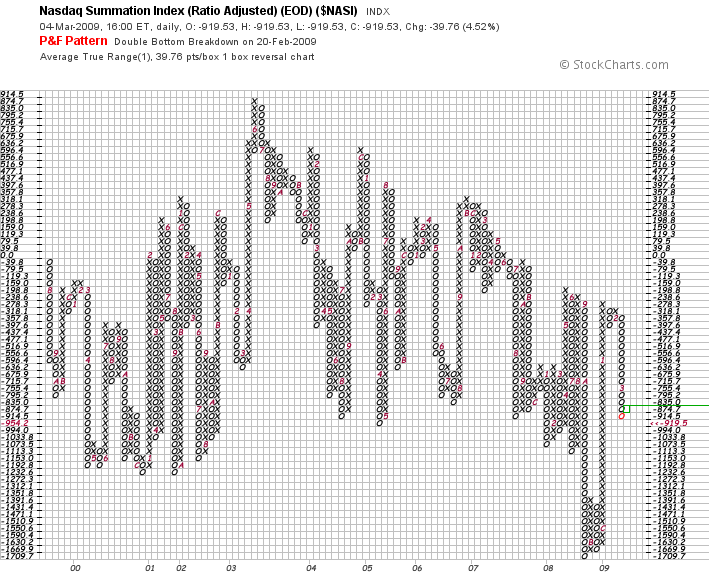
- 3 : NASDAQ Summation Index
Although the NASDAQ was up more than 2.5% today, 3 of my indicators remain bearish.
Chart 1: QQQQ (NASDAQ 100 ETF) is falling with volume not seen since Lehman’s went bust, yet it remains above the November lows. This feels like a dead cat bounce before the floor falls out.
Chart 2: This NASDAQ indicator synthesizes the % of Rising NASDAQ Stocks and NASDAQ Volatility, expressing a market environment beyond price. When it’s going up (X’s), more stocks are rising amidst lower volatility, and when it’s falling (O’s), volatility is increasing as fewer stocks increase. No X’s have been made, so I’m staying in cash.
Chart 3: An explanation of the Summation Index can be found here. Like the other two indicators, without a new row of X’s, there is no sign of a upside reversal.