Twitter Ticker ($FUQI)
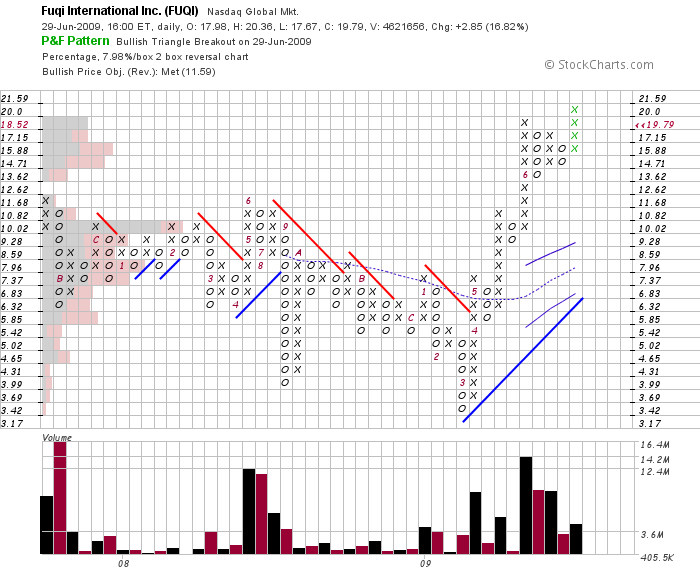
 Fuqi International (pronounced foo-chee) has caught the attention StockTwits as the Chinese jewelry company forms a bullish triangle breakout. Increasing Asian prosperity bodes well for this precious metals distributor and so growth expectations are rising.
High above a rising upper Bollinger, 13.62 is the only visible support, so position accordingly. Broad market conditions continue to improve and favors selective investment in rising stocks.
I’ve noticed many participants willing to short this market, so perhaps they will fuel a fire that sends the bull charging. On the other hand, the economy appears to be a disaster, and though such indicators lag, I do not trust the Madoffian TARPicidal Cap ‘N’ Tradatics who rule in my name.
Hi Charles,
I’m somewhat familiar w/ P&F charts, but what are the grey and red shaded boxes on the left-hand side of the price chart?
Also, I note one price column near the top does not correspond ($18.52 left and $19.79 right). Could you explain these aspects of the chart please? Thanks.
Hi David,
Thanks for reading and I appreciate the question. The shaded boxes on the left represent volume by price, or the amount of shares traded in a given range for the life of the chart. To answer your second question, the price on the right is the last recorded price, and the price on the left remains consistent with the logarithmic interval of 7.98% (derived from the 20 period Average True Range). If you have any other question or comments, please feel free to let me know.
Thanks Charles,
So if I read you correctly, the volume boxes show that highest volume by price (on FUQI) occurred at 10.02 mark. Does the preponderance of grey boxes (vs. red) at this level indicate mostly “buy volume” occuring around this price?
You got it.